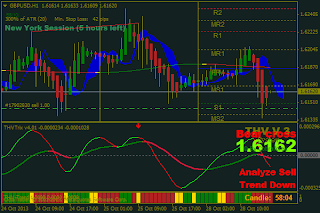
The risk levels:
If you are a very experienced trader you can ignore the coral (risk level 1) when you think it will be still a good trade, for newcomers I recommend to stay with the coral rules (risk level 2) until you have min. 10% monthly gains for at least 3 month in row.
Trading direction.
The green and red, interrupted by yellow line (Coral) is our line in the sand to determinate the trading direction.
We only take a long trade when the cloud and price is above the Coral and short below the Coral (here a V2 chart). I would use the coral only on 1M and 5M time frames.
Entry:
Above Coral only long, below Coral only short
Price crosses cloud - both Trix cross each other and have the same color.
Best and most secure trend confirmation is a cross of the fast Trix on the zero level.
Exit:
Faster Trix changes color and/or touch of a known good resistance/support level.
Filter choppy market condition.
We have, thanks to the Coral, the possibility to filter choppy market conditions like early Asian or late Fridays session. You see that we didn’t get permission to enter any trade in the area highlighted in the red boxes (V2 version chart).
The green boxes show trading conditions after breaking the Coral and retest the Coral or cloud or a pivot level. But this screenshot was made in the late Friday session and it is best to avoid trading that time.
Overbought-oversold conditions
Each TF presents different settings on the Trix levels and passing those levels we can consider them as overbought and oversold. I f you like you can confirm them on your Analyze candlestick chart with the RSI indicator.
If you see the PA passing those levels and the fast Trix changes color you can switch to 1M and look for a fast scalp trade, they have a very high hit rate. Here a trading example, a good short setup, the fast Trix on all Tf’s (1,5,15) hide to the south (red), once the support of the 1M TF is broken and retested we can take the trade.
The Analyze chart
In all HA candle systems it is recommended to use an additional candlestick chart. We offer the analyze chart where you draw your TL’s, HL’s, Fib’s, channels, Pivots etc.
It includes a RSI indicator for additional reference of overbought and oversold areas. Between the green lines you have bull territory and between the red ones bear territory.
Other additional indicators in the optional folder:
- FerruFX multi indicator for trend strength in %
- Trading simulator for MT4, coded by Quantem
- Old hull replacement for the ones that miss the hull toooo much
Trading FX is patience, wait for the right setup and take the trade, you will be rewarded mostly if you don’t forget the rules.
Dowload THV V3 Indicator, Sound, Template
Download Analysis Chart
Download THV Tutorial
Downlod MTF Indicators Manual


0 comments:
Post a Comment