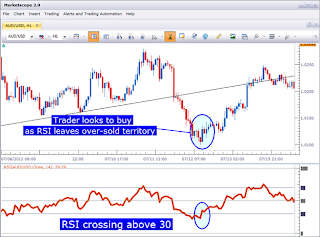
RSI (relative strength index) indicator is an indicator that can be used to indicate overbought/oversold conditions, positive/negative divergence, and also a price reversal of momentum trading. The value of RSI itself always in the range of 0-100. The most basic function of RSI is to look for a buy signal when prices exceeded 30 lines or, where price will probably reach the point of moving oversold. For that, look at the screenshot below is an example of the use of RSI indicator.
RSI moves according to the current price at the time. It would indeed be a common trait of the indicators. Therefore, traders often use a moment such as this, to make deals with the indicator RSI. However, if there are new prices in progress, sometimes can cause the indicator to be incompatible with the price movement. The nature of the RSI that is looking for and determine when the price reversal occurs. When price is moving up to level 30, then was named as oversold. While oversold is a good time to make a purchase or buy action, because the price of the currency at the time in a State of bearish (down). But if the movement rates were below the level 70, then this is known as overbought. Overbought when is a good time to sell.
A trader must have a strong risk management. Because of the trend can be changed at any time, at a certain time, the trend could develop more quickly, or even reverses direction without us guess. Price at any time can counteract the transaction we have made. So, use with appropriate risk management to minimize the possibility of losers.
Subscribe to:
Post Comments (Atom)


0 comments:
Post a Comment