Many traders consider the candlestick charts more attractive and easily interpreted visually from the traditional bar graph. Each unit provides a representation of the candlestick easily parsed the motions of the price. Traders with segara can compare the relationship between the price of opening and closing as well as the highest and lowest prices. The relationship between opening and closing price is seen as a vital information and forms the essence of the candlestick.

We can easily read the market conditions. By looking at patterns and candlestick type we can see the first signs of a reversal of direction or reversal. Empty Candlestick, where the closing price is greater than the opening price, indicates the pressure to buy. Otherwise solid candlestick, where the closing price is lower than the opening price, indicates the pressure sell.
Among the many candlestick patterns & type, one of the important ones are:
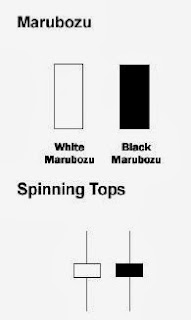
1. Morubozu
Marubozu was bar full body without shadow. Usually an indication of the start of a trend will be sustainable. Candlestick is a stronger long Marubozu brothers, namely, black and White. Marubozu don't have upper and lower shadows, up to the highest point and the lowest price is represented by the opening or closure.
White Marubozu forms when the opening price equals the lowest point and the price equivalent of the highest point of its closure. This indicates that the buyer's price control from beginning to end the trade. Black Marubozu forms when the opening price is equivalent to its highest point and closing price equates to the lowest point. This indicates that sellers control prices from beginning to end the trade.
2. Spinning Tops
Candlestick with a long upper shadow, bottom shadow length and small body called with spinning tops. A long shadow reflect the reversal of its kind; spinning tops reflect doubt. Small Body (solid or empty) describing small movements from the opening to closing, and shadow indicate that neither the bulls maupaun bears the same active during that session.
Although the session opened and closed with little change, high and low price moves significantly during that time. The buyer and the seller are unable to menangguk the fortunes and the results were ruled out. After a long hike or a long white candlestick, a spinning tops indicates the weakness of the bulls and there is a potential change or interruption of the trend. After a long decline or long black candlestick, a spinning tops indicate weakness bears and there is a potential change or interruption of the trend.
3. Doji
Doji occurs if the open price is equal to the price close so the body only form a line. A sign of Doji after White Bar (bar = bullish rise) trend indicate ride coming to an end, but these indications must be confirmed with the emergence of the black bar (bar = bearish down) and vice versa.
4. The Hammer and Hanging Man or a Shooting Star and Evening Star
The Hammer and Hanging Man can also be an indication of a reversal in the trend direction as shown in the picture below, this indication must be confirmed also with a bar that happened afterwards. Terms of the Hammer and Hanging Man is a Shadow must be longer than the body.
Indications indicated by candlestick could be made as early indications of price movements but cannot serve as a reference point because it is only trend indicates the movement for some of the candle to the fore.


Nice Article, you described very well about candlesticks charts. Traders of stocks and other financial markets often use candlesticks. Doji is one of the favourite candlestick patterns of all traders. See here for more details
ReplyDelete