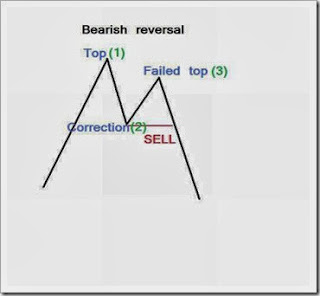
Traders often use this pattern to enter the market or are there also are using it to get out of the market. This is one of the basic patterns that exist in forex, which is also very often used by traders. This pattern is known as the pattern 1-2-3 or 1-2-3 pattern. Chart patterns like this usually indicates there is a reversal of direction or the end of the trend.
Chart 1-2-3 pattern similar to Fibonacci is usually used in conjunction with other indicators such as macd, rsi, stochastic, etc. The below image is the application usage chart 1-2-3 pattern on metatrader.
The pattern below is a Bearish reversal, where denotes the up trend has ended and the red line indicates the entry sell position is often used to enter the market.
The pattern below is Bulish Reversal pattern that the pattern chart 1-2-3 which indicates reversal of direction or the expiry of the down trend. Buy red marks indicate where usually traders began to enter the market.
Subscribe to:
Post Comments (Atom)


0 comments:
Post a Comment