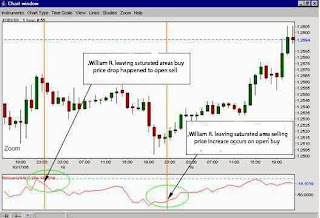
The same is true in saturated concept to sell. The difference here is the selling price means saturated the currencies have been too cheap so that the seller is no longer possible to sell its own currency because the price is too cheap for sale. Thus a currency that is experiencing a decrease in saturated areas and then entered the selling then it is no longer the currency exchange rate will soon stop going down and will again increase.
Saturated Area buy and sell this saturation measured by r. Williams, the trick is to compare the closing time of the last highest price lowest price reduced on the desired period.
For more details see the following picture:
Now the next question is where are the saturated area buy and sell according to the saturated R Williams
If you have ever studied indicators of saturated buy-sell saturated such as RSI, then we think Williams R is not difficult for you to interpret. Williams R reading exactly the same with the RSI. The difference is that Williams R is the range 0 to-100.
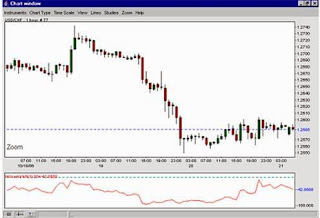
When Williams R refer to figures 8 and above (i.e. 0 to-20) is a saturated area buy and vice-versa-80 down (-80 to-100) is a saturated area of selling. The boundary between the two areas (-20 to-80) is the neutral point where prices still have the possibility to rise or fall further. Midpoint Williams R is-50.
Well, similar to the RSI instead? Now let's look at the following image carefully:
Having regard to the above image seems more than enough to bring a sense of the use of indicators on this one. It's good you read RSI in advance in order to deepen the use of indicators that are such oscillator Williams R.
The advantages and disadvantages
Now we come to the part of the advantages and disadvantages of Williams r. as in other oscillator indicators, Williams R has the same advantages and disadvantages.
Pros:
- Ease in reading
- Relatively more accurate than the RSI to perfect his creation is indeed due to RSI.
- Able to predict price movement faster than an indicator of trend (trend indicator)
Disadvantages:
- Often cause false signals because its too sensitive (marked with a visible indicator of curly curve). For it is advisable to extend the period of Williams R to 20 (default is 2) or add the Moving Average on Williams R.
- Williams R has a limited range. Sometimes prices move in a very Bullish conditions or very Bearish. In a State so Williams R can no longer provide the signal Open Buy and Sell because the price moves in one direction in a long range. For it is recommended to use the indicator trend to be tandem Williams R such as MACD or MA.
It should be noted here that the range of-20 and-80 is not absolute in its use of the range Williams r. some traders use restrictions as-10 and-90 to be saturated and unsaturated bounds buy jualnya same as RSI.
Well we think enough reviews here to brief about Williams r.


0 comments:
Post a Comment