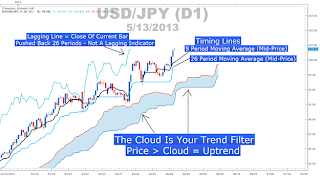
Ichimoku provides information to traders with one approach on market analysis. Bottom line, you can see if the market is trending or not. If the market is trending, the Ichimoku can help see where points of support and resistance are currently located. Automatically You can also see the predictions of prices in the future.
The cloud on ichimoku gives you the ability to see if the trend is obvious and can be analyzed or not. When the price is above the cloud, often inform the trend is rising. While if the price is below cloud, usually the price trend for fall. In addition to two lines, the line triggers (trigger line) and baseline (base line), providing a time element that helps you to get into the direction of the trend.

Ichimoku has two basic functions, which should be known to every trader. First, Ichimoku provides information about the trends that happen today. The Trader can look at lagging line, because it can help answer the above question. If the indicator is above the price of 26 last period, then we could technically says market conditions are currently rising.
The second function is to answer where prices are likely to continue. It is of course far more difficult to answer. Especially when not all traders must trust that the Ichimoku have definitive answer on a trend. There are various indicators in the world of forex trading. But the privilege is, he can Ichimoku show where prices will be in a week, month, even year counted from now on.
Simply put Ichimoku just focused on coverage of the important time and applying them forward and backward in time frame trading. The result is you get the full picture when trading-in the time frame that you choose.
Figure 26 is very important for the indicator Ichimoku. What's up with number 26? According to the discoverers, the number 26 is the most suitable in a set pattern of prices for the indicator Ichimoku. The period is used as the basic take on people who work for 26 working days in a month, and 26 weeks for half a year if you're in the weekly chart. Thus, this period is believed to be able to bring good luck long term analysis.

0 comments:
Post a Comment